OPC Data Acquisition

| OPC Data Acquisition | |
Genesis OPC Explorer 3.1 |
Genesis OPC Explorer 3.1 Menu Genesis OPC Explorer 3.1 Fast Track What's New in Release 3.0 Feedback and Awards Download Counters Download Genesis OPC Explorer 3.1 Safe Use of Genesis OPC Explorer 3.1 Genesis History Genesis OPC Explorer Setup Select OPC Server Manage OPC Groups Manage Acquired OPC Items Manage Calculated OPC Items Load OPC Project Save OPC Project Close OPC Project Data Acquisition and Storage Start Data Acquisition Resume Data Acquisition Stop Data Acquisition Display Performance Data Acquisition Data Matrix OPC Data Listing Display of OPC Data Listing Export OPC Data Export to Clipboard Toggle Performance Display Configure Types Color OPC Data Charting Display of OPC Data Chart Set Chart Series Colour Set Chart Title Options Manipulate Chart Display Set Series Selection Set Chart Axis Set Chart Legends Save Chart Image as File Save Chart Image to Clipboard Enable Cursor Data Toggle Server Data Display Registration and Support Register Genesis OPC Explorer 3.1 Support of Genesis OPC Explorer 3.1 Register Support of Genesis OPC Explorer 3.1
|
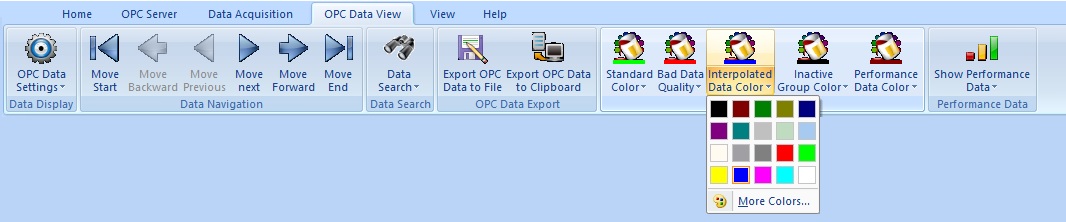
Configure Genesis Data Types Color
The OPC Data Listing View shows always the following data:
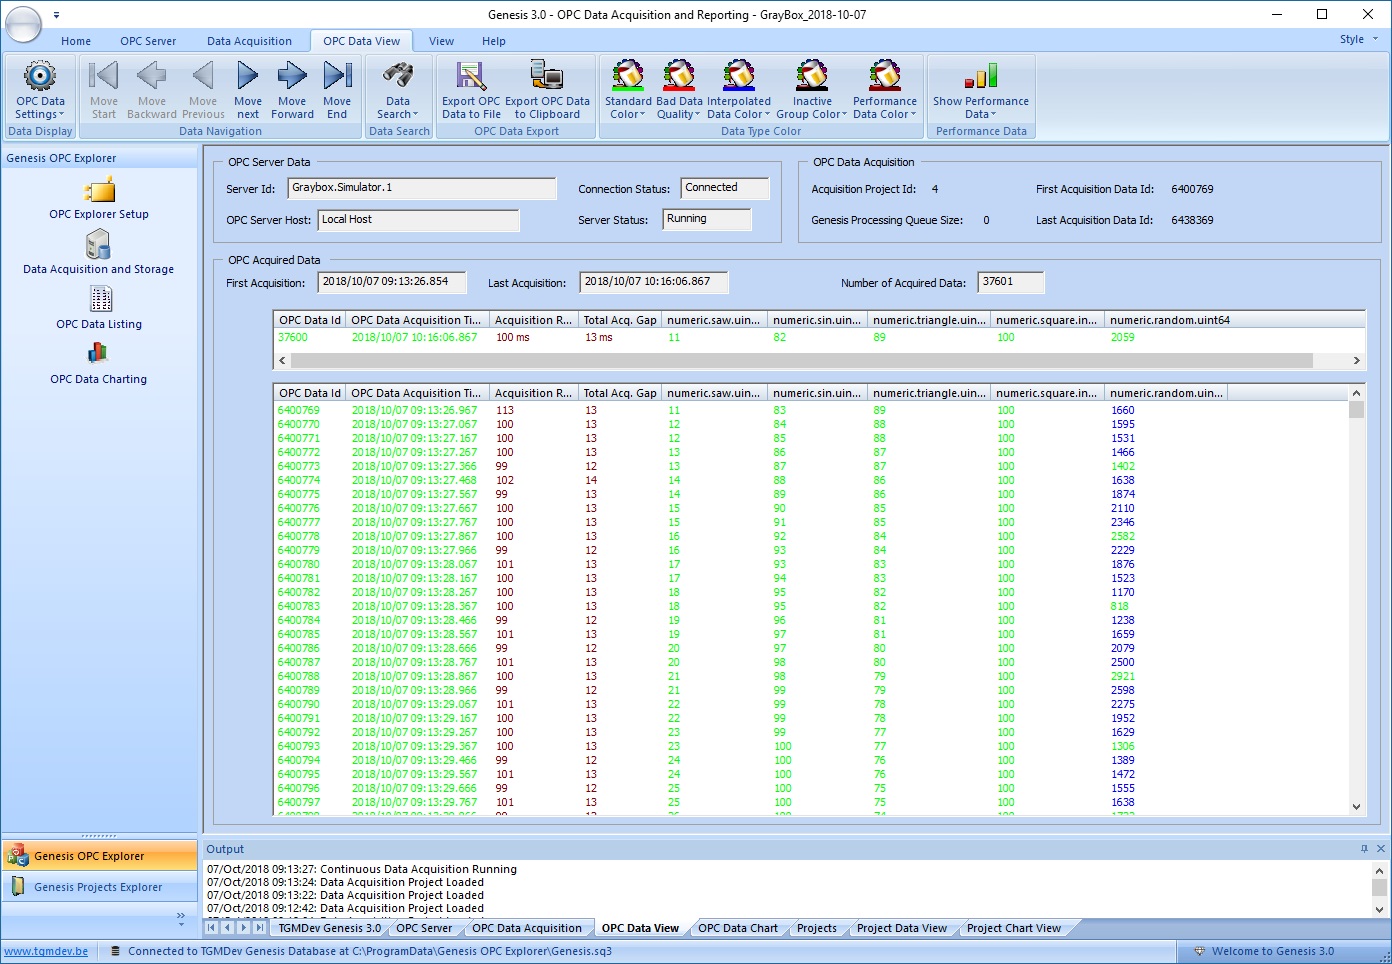 OPC Data Listing View with Coloured Data Type
In the case showed above, the first four tags are part of an OPC group with an acquisition rate of 100 milliseconds. The last one belongs to a second OPC group with an acquisition rate of 500 milliseconds Every 100 ms, an OPC Data acquisition takes place for all the tags of the first group and only one time on five for the last tag. So, to fill the gap between the acquired data of the last tag, the date are interpolated lineary between the acquired data. The interpolated data are displayed in blue (one green followed by 4 blue, to get 5 acquisition rates) Some combinaisons of OPC acquisition rates could lead to more complex patterns of data interpolation. |
Tell your Friends about Genesis OPC Explorer 3.1 Visitors Count: 35117 |
||||||||||||||||||||||||||