OPC Data Acquisition

| OPC Data Acquisition | |
Genesis OPC Explorer 3.1 |
Genesis OPC Explorer 3.1 Menu Genesis OPC Explorer 3.1 Fast Track What's New in Release 3.0 Feedback and Awards Download Counters Download Genesis OPC Explorer 3.1 Safe Use of Genesis OPC Explorer 3.1 Genesis History Genesis OPC Explorer Setup Select OPC Server Manage OPC Groups Manage Acquired OPC Items Manage Calculated OPC Items Load OPC Project Save OPC Project Close OPC Project Data Acquisition and Storage Start Data Acquisition Resume Data Acquisition Stop Data Acquisition Display Performance Data Acquisition Data Matrix OPC Data Listing Display of OPC Data Listing Export OPC Data Export to Clipboard Toggle Performance Display Configure Types Color OPC Data Charting Display of OPC Data Chart Set Chart Series Colour Set Chart Title Options Manipulate Chart Display Set Series Selection Set Chart Axis Set Chart Legends Save Chart Image as File Save Chart Image to Clipboard Enable Cursor Data Toggle Server Data Display Registration and Support Register Genesis OPC Explorer 3.1 Support of Genesis OPC Explorer 3.1 Register Support of Genesis OPC Explorer 3.1
|
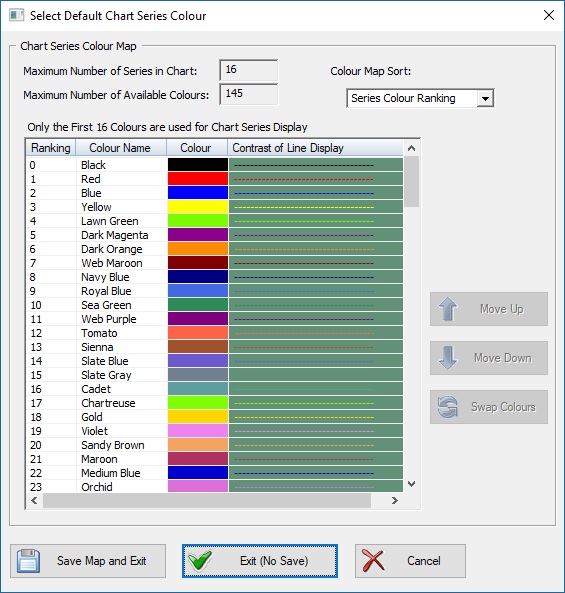
Set Chart Colour Settings
The Chart Series Colour are defined in the Genesis Colour Map. This map provides the choice for the chart series colour amongst about 150 different colours. The first colours will be used to draw the first series on chart (by default, the chart provides 6 chart series).
See Also Manipulate Chart Display Set Series Selection Set Chart Axis Set Chart Legends Save Chart Image as File Save Chart Image to Clipboard Enable Cursor Data Toggle Server Data Display |
Tell your Friends about Genesis OPC Explorer 3.1 Visitors Count: 35117 |
||||||||||||||||||||||||||