OPC Data Acquisition

| OPC Data Acquisition | |
Genesis OPC Explorer 3.1 |
Genesis OPC Explorer 3.1 Menu Genesis OPC Explorer 3.1 Fast Track What's New in Release 3.0 Feedback and Awards Download Counters Download Genesis OPC Explorer 3.1 Safe Use of Genesis OPC Explorer 3.1 Genesis History Genesis OPC Explorer Setup Select OPC Server Manage OPC Groups Manage Acquired OPC Items Manage Calculated OPC Items Load OPC Project Save OPC Project Close OPC Project Data Acquisition and Storage Start Data Acquisition Resume Data Acquisition Stop Data Acquisition Display Performance Data Acquisition Data Matrix OPC Data Listing Display of OPC Data Listing Export OPC Data Export to Clipboard Toggle Performance Display Configure Types Color OPC Data Charting Display of OPC Data Chart Set Chart Series Colour Set Chart Title Options Manipulate Chart Display Set Series Selection Set Chart Axis Set Chart Legends Save Chart Image as File Save Chart Image to Clipboard Enable Cursor Data Toggle Server Data Display Registration and Support Register Genesis OPC Explorer 3.1 Support of Genesis OPC Explorer 3.1 Register Support of Genesis OPC Explorer 3.1
|
Display OPC Data Chart
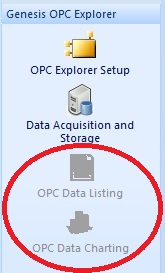
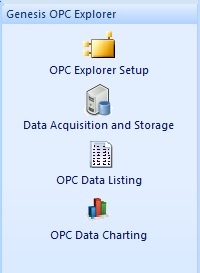
Once the data acquisition is started (see here for details), the icons in the left pane of Genesis OPC Explorer 3.1 main window turn activated.
On click on the button 'OPC Data Charting', Genesis OPC Explorer 3.1 displays the Data Acquisition Chart. 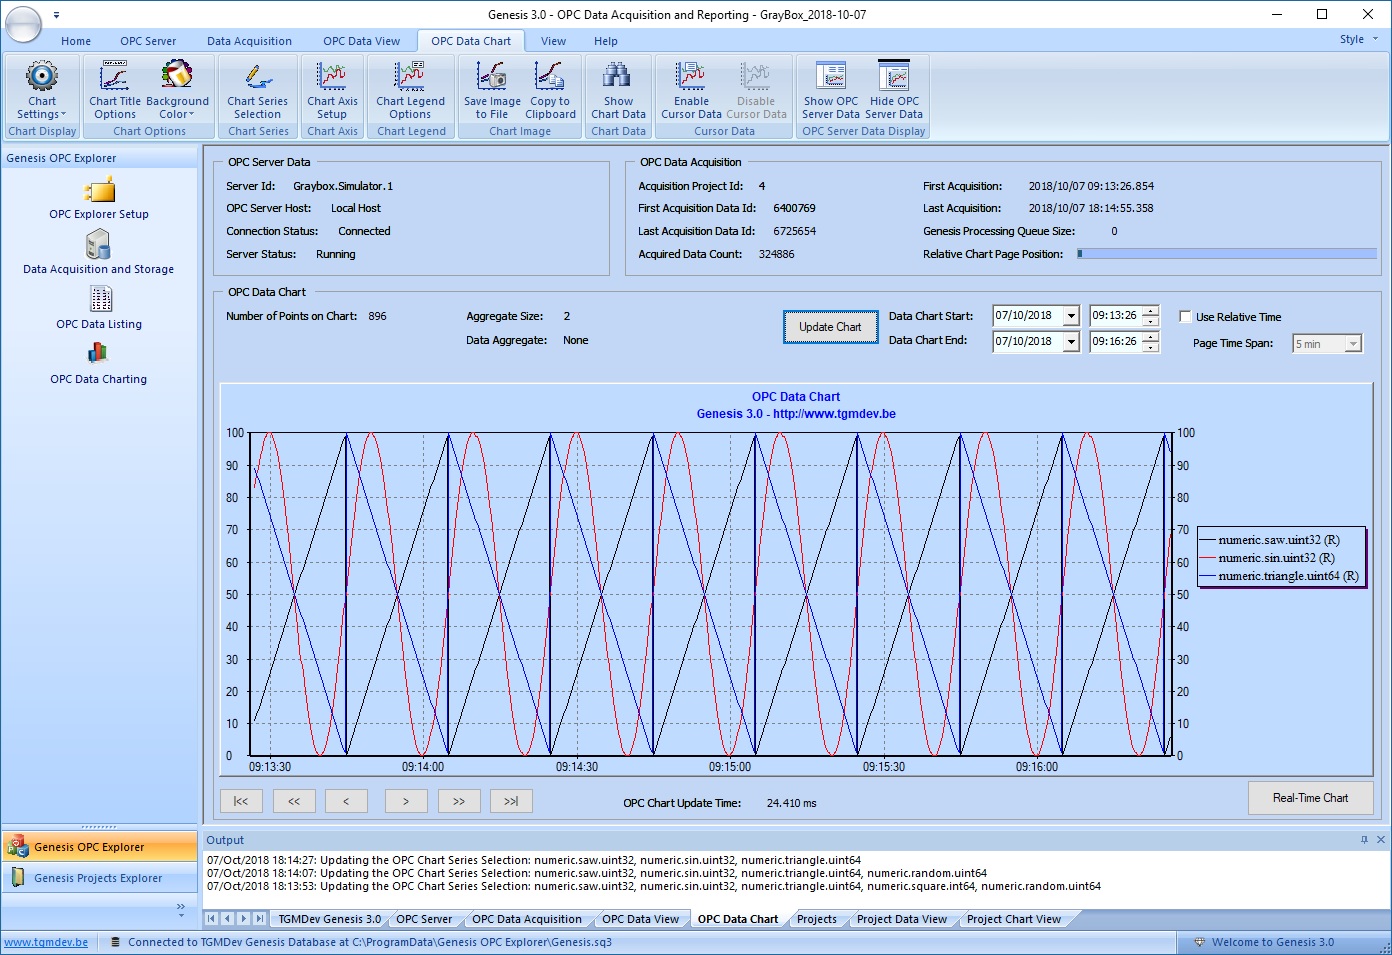 OPC Data Chart View Click on the different elements (draw in blue in the table below) below to view localization of OPC Data Information.
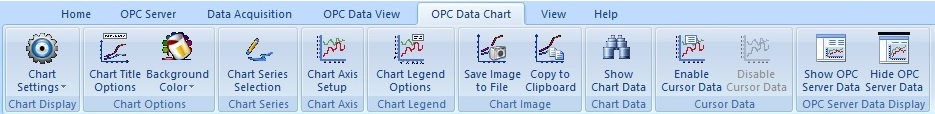 OPC Data Chart Ribbon Using the different buttons of the ribbon, you can
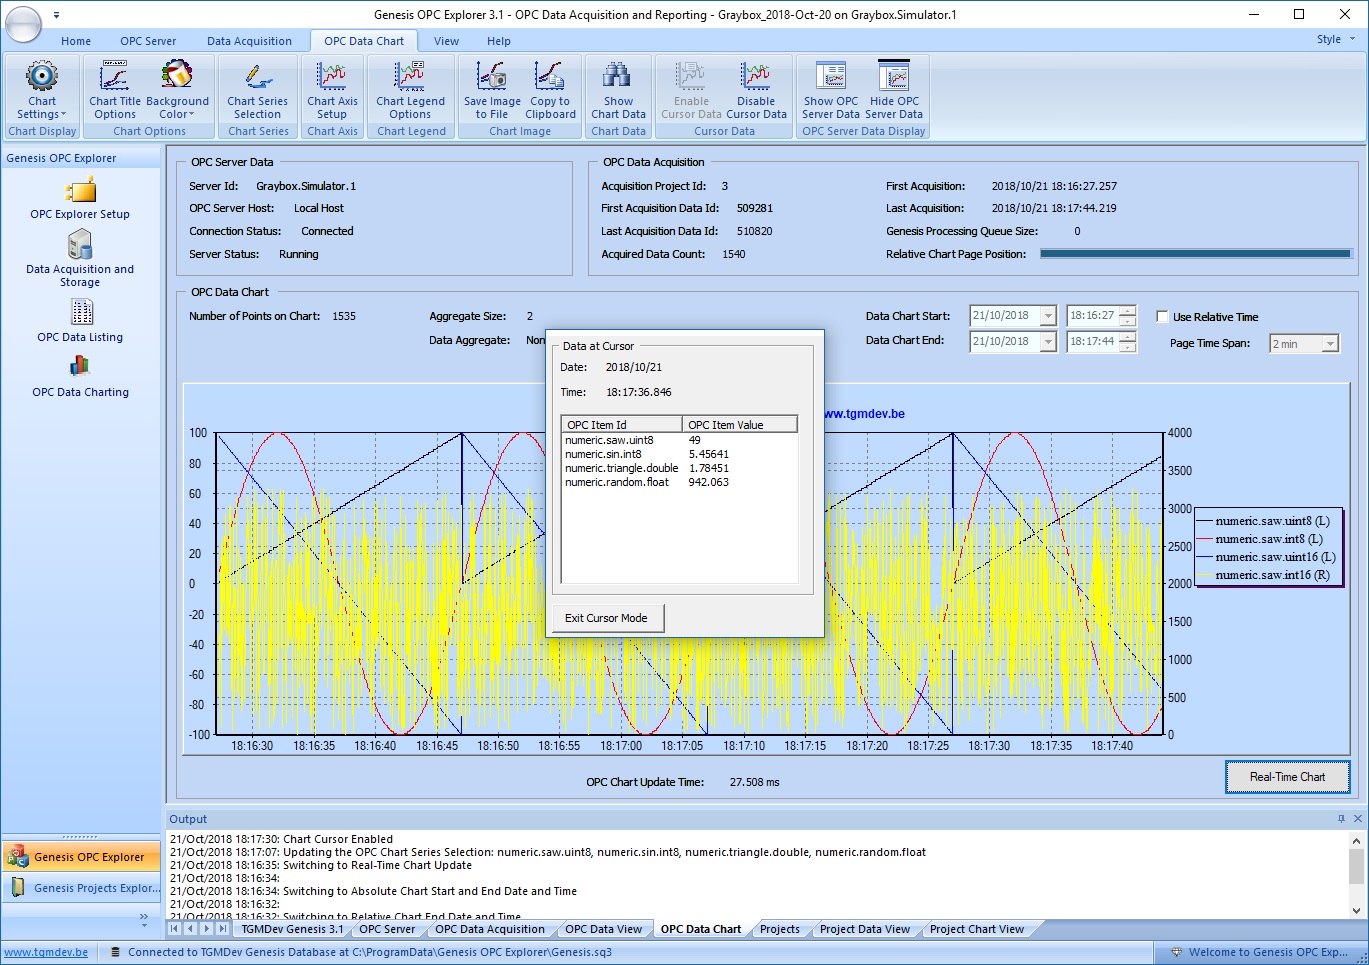 OPC Data View with Cursor Data
See Also Set Chart Series Colour Manipulate Chart Display Set Series Selection Set Chart Axis Set Chart Legends Save Chart Image as File Save Chart Image to Clipboard Enable Cursor Data Toggle Server Data Display |
Tell your Friends about Genesis OPC Explorer 3.1 Visitors Count: 35117 |
||||||||||||||||||||||||||||||